Privately tested by Waterlab Corp

North Santiam River water test results

Independent field samples from 6 stations between Detroit Lake and North Santiam State Park, taken before and during the 2026 Detroit Dam drawdown. Every published sample is listed here by station and by date.

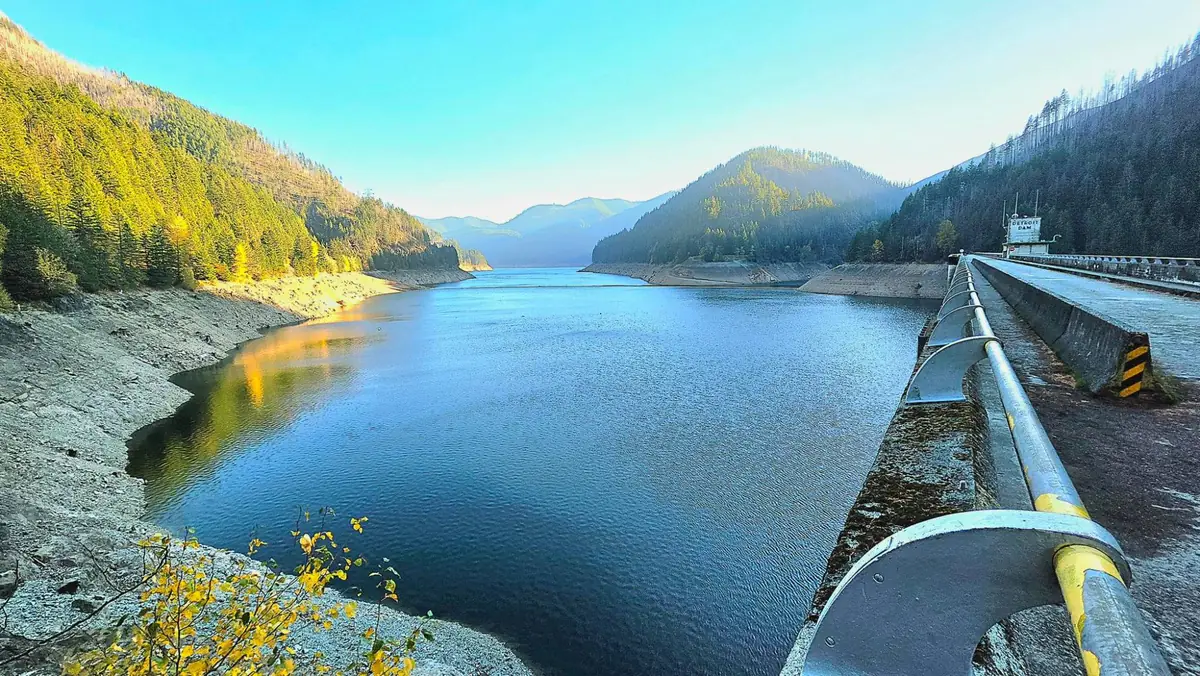
Detroit Lake seen from the top of Detroit Dam, with a band of bare shoreline exposed below the tree line
Detroit Lake from the top of Detroit Dam ·
Latest sampling run
Nov 1, 2026
Stations with results
5 of 6
Highest turbidity, latest run
7.19 NTU
Detroit Lake Boat Ramp (Mongold)

Upstream to downstream

Latest result at each station

The most recent published sample from every station. Station 1 is on the reservoir above Detroit Dam; the rest follow the river downstream.

#StationTurbidityTemperaturepHConductivityTDSSampled
#1
Detroit Lake Boat Ramp (Mongold)
Detroit Lake State Park · Reservoir
7.19 NTU57.0 °F6.9559 µS/cm31 ppmNov 1, 2026
#2
Detroit Dam Tailrace
Below Detroit Dam
0.509 NTU55.2 °F6.9262 µS/cm31 ppmNov 1, 2026
#3
Big Cliff Tailrace
Below Big Cliff Dam
0.329 NTU56.1 °F6.9571 µS/cm31 ppmNov 1, 2026
#4
Packsaddle Park Boat Launch
Near Gates
—————No samples yet
#5
Fishermen's Bend Boat Launch
Near Mill City
0.474 NTU56.8 °F6.7473 µS/cm41 ppmNov 1, 2026
#6
North Santiam State Park Boat Ramp
Between Mill City and Mehama
0.352 NTU57.4 °F6.80105 µS/cm48 ppmNov 1, 2026

NA means that test has not been run on the sample. A dash means the station has no published sample yet.

Partnership readings · North Santiam intake near Stayton

Partnership Readings with City of Stayton

The City of Stayton's licensed water system operators measure turbidity every day at the North Santiam River intake near Stayton, where the river reaches the slow sand filtration plants that supply Stayton, Salem and the surrounding communities. Through this partnership they share that daily record here. It is the most frequent turbidity record on the site, taken at the point that matters most for drinking water, and it fills in every day between our sampling runs.

Latest reading1.8 NTUNov 8, 2026
Last 7 days1.8–1.8 NTU1 reading
Highest on record1.8 NTUNov 8, 2026
Days on record1since Nov 8, 2026

Daily turbidity at the intake, every reading

Measured by City of Stayton water system operators with the plant's own instruments.

Daily readings from the City of Stayton
DateTurbidityTemperaturepHNotes
Nov 8, 20261.8 NTUNANATEST - NOT ACTUAL DATA

Full record

Results by sampling date

2 sampling runs have been published since Oct 16, 2026, newest first.

Nov 1, 2026

5 of 6 stations sampled. Turbidity ranged from 0.329 NTU at Big Cliff Tailrace to 7.19 NTU at Detroit Lake Boat Ramp (Mongold).

Field results for the Nov 1, 2026 sampling run
#StationTurbidityTemperaturepHConductivityTDS
#1Detroit Lake Boat Ramp (Mongold)Detroit Lake State Park · Reservoir7.19 NTU57.0 °F6.9559 µS/cm31 ppm
#2Detroit Dam TailraceBelow Detroit Dam0.509 NTU55.2 °F6.9262 µS/cm31 ppm
#3Big Cliff TailraceBelow Big Cliff Dam0.329 NTU56.1 °F6.9571 µS/cm31 ppm
#5Fishermen's Bend Boat LaunchNear Mill City0.474 NTU56.8 °F6.7473 µS/cm41 ppm
#6North Santiam State Park Boat RampBetween Mill City and Mehama0.352 NTU57.4 °F6.80105 µS/cm48 ppm

Oct 16, 2026

4 of 6 stations sampled. Turbidity ranged from 0.641 NTU at Detroit Dam Tailrace to 25.5 NTU at Detroit Lake Boat Ramp (Mongold).

Field results for the Oct 16, 2026 sampling run
#StationTurbidityTemperaturepHConductivityTDS
#1Detroit Lake Boat Ramp (Mongold)Detroit Lake State Park · Reservoir25.5 NTUNANA45.7 µS/cmNA
#2Detroit Dam TailraceBelow Detroit Dam0.641 NTUNANA48.8 µS/cmNA
#3Big Cliff TailraceBelow Big Cliff Dam0.709 NTUNANA48.6 µS/cmNA
#5Fishermen's Bend Boat LaunchNear Mill City0.802 NTUNANA48.5 µS/cmNA

Reading the numbers

What each test measures

Turbidity (NTU)
Cloudiness caused by suspended particles such as silt and clay, measured in nephelometric turbidity units. This is the measurement the drawdown debate turns on, because sediment stirred up behind Detroit Dam shows here first. In the federal lawsuit, Salem asked that the drawdown pause whenever river turbidity reaches 10 NTU (Willamette News).
Water temperature (°F)
Water temperature when the sample was collected. Water released from a reservoir can run warmer or colder than the river would naturally, depending on the depth it is drawn from.
pH (pH)
How acidic or alkaline the water is on a 0 to 14 scale, where 7 is neutral.
Conductivity (µS/cm)
Specific conductance: how readily the water carries an electric current, in microsiemens per centimeter. It rises as dissolved minerals and salts increase.
Total dissolved solids (ppm)
Total dissolved solids: the minerals and salts dissolved in the water, in parts per million. It is read separately from conductivity, not converted from it.

Sampling locations

Where the samples are taken

All 6 stations are public access points, numbered from the reservoir downstream.

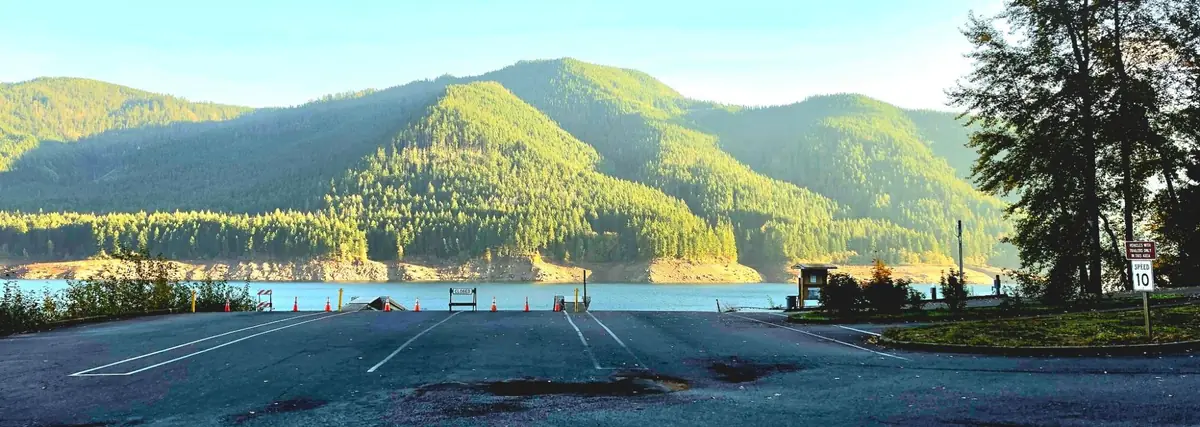
A boat ramp on Detroit Lake blocked off with cones and a Closed sign, the lake low behind it
A closed boat ramp on Detroit Lake ·
  1. Station 1 · Detroit Lake State Park · Reservoir

    Detroit Lake Boat Ramp (Mongold)

    Reservoir sample taken from the public boat ramp at the Mongold day-use area of Detroit Lake State Park, above the dam. This is the water that is drawn down.

    44.7122, -122.1929 · 2 published samples, first on Oct 16, 2026

  2. Station 2 · Below Detroit Dam

    Detroit Dam Tailrace

    Immediately downstream of Detroit Dam, where released reservoir water first enters the river. The first place drawdown sediment can be measured.

    44.7234, -122.2549 · 2 published samples, first on Oct 16, 2026

  3. Station 3 · Below Big Cliff Dam

    Big Cliff Tailrace

    Below Big Cliff, the reregulating dam that smooths Detroit's releases before the river runs free through the canyon.

    44.7535, -122.2900 · 2 published samples, first on Oct 16, 2026

  4. Station 4 · Near Gates

    Packsaddle Park Boat Launch

    Boat launch at Marion County's Packsaddle Park, in the canyon between Big Cliff Dam and Gates. First sample planned for November 15, 2026.

    44.7575, -122.3706 · No published sample yet

  5. Station 5 · Near Mill City

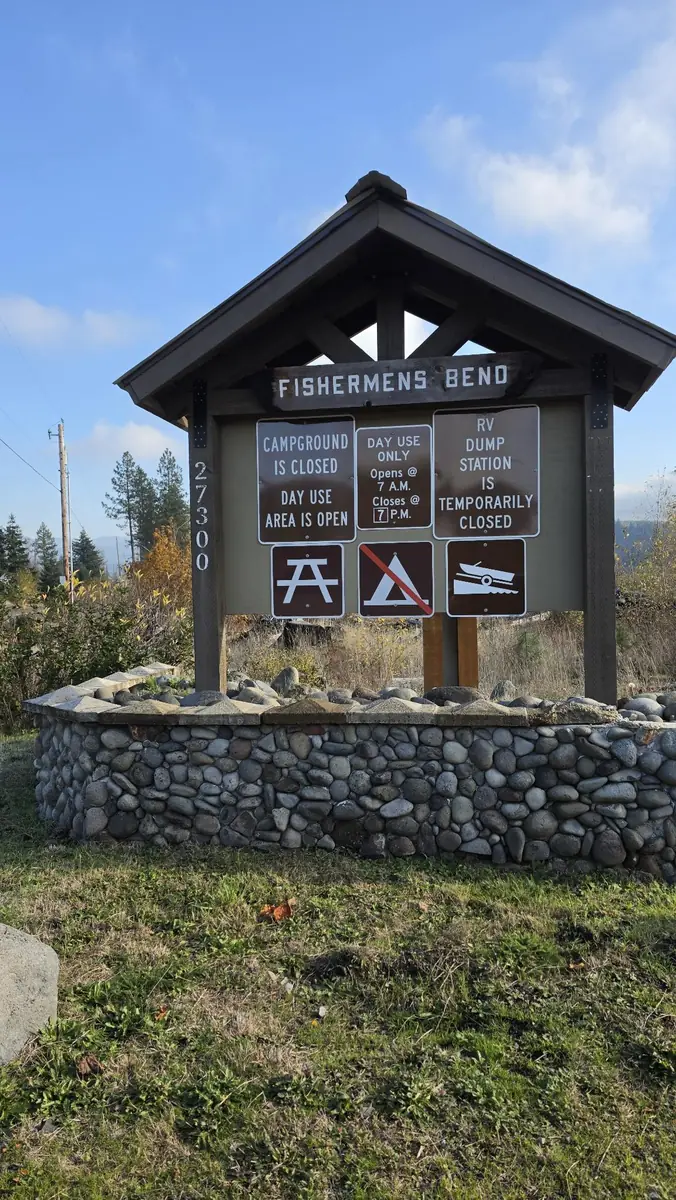
    Fishermen's Bend Boat Launch

    Public boat launch at the BLM Fishermen's Bend Recreation Site, 1.5 miles west of Mill City, upstream of the Stayton and Salem intakes.

    44.7534, -122.5144 · 2 published samples, first on Oct 16, 2026

  6. Station 6 · Between Mill City and Mehama

    North Santiam State Park Boat Ramp

    Boat ramp at North Santiam State Recreation Area, about four miles downstream of Mill City. The last station before the river reaches the Stayton and Salem intakes.

    44.7711, -122.5650 · 1 published sample, first on Nov 1, 2026

See the stations on the river map

Before you rely on it

About this data

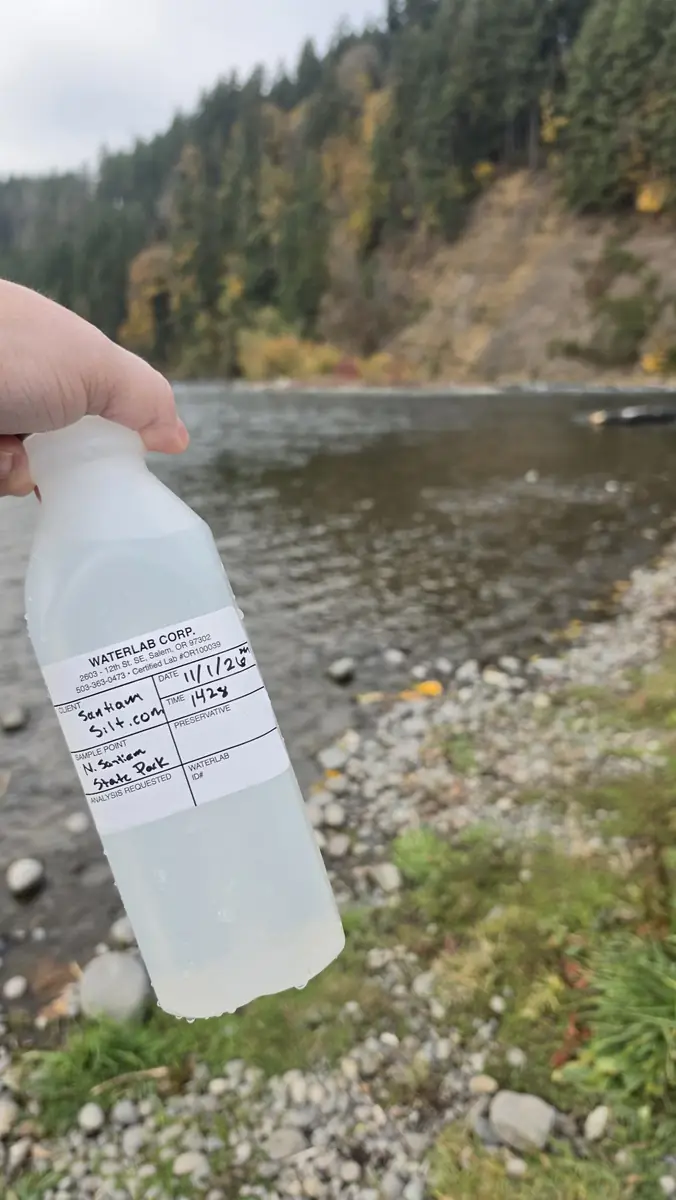
  • Who tests it. Samples are collected in person at each station and tested by Waterlab Corp, an Oregon drinking-water testing lab. The work is privately funded and independent of the agencies and cities involved in the drawdown.
  • What gets published. Only reviewed samples appear here. Nothing is estimated or filled in: a test that was not run shows as NA.
  • Partnership readings. The City of Stayton's daily intake readings are measured by the city's licensed water system operators as part of running a public drinking-water plant, and they publish here the moment the city enters them. They are credited to the city so readers know which record they are looking at: a professional operator's daily measurement at the intake, alongside Waterlab's less frequent samples along the river.
  • How it differs from the federal gauges. The U.S. Geological Survey gauges on this site report continuous turbidity in FNU from fixed sensors. These field samples report NTU from individual samples. The two scales are close but not interchangeable, so compare timing and direction rather than exact values.
  • What it is not. This is river and reservoir water, not treated tap water, and it is not for regulatory or health decisions. For drinking-water guidance, follow your own water utility.